19 February 2026
Alarm management and data visualisation have key roles to play in helping an industrial monitoring systems deliver actionable insights in real time. In this article, we’ll explain how advanced human-machine interface solutions, such as the Sentry G3 SCADA Viewer from Sensonics, can streamline a range of your industrial processes and safety systems.

What is alarm management and why does it matter?
An alarm management system handles and prioritises system alarms to maintain operations and safety processes. In industrial and power generation facilities, there are often many processes running concurrently, so that without a clear alarm management protocol in place, operators may struggle to prioritise critical alarms among more routine notifications – a phenomenon known as ‘alarm flood’.
The Sentry G3 SCADA Viewer helps you overcome these challenges with a range of powerful alarm management features, such as:
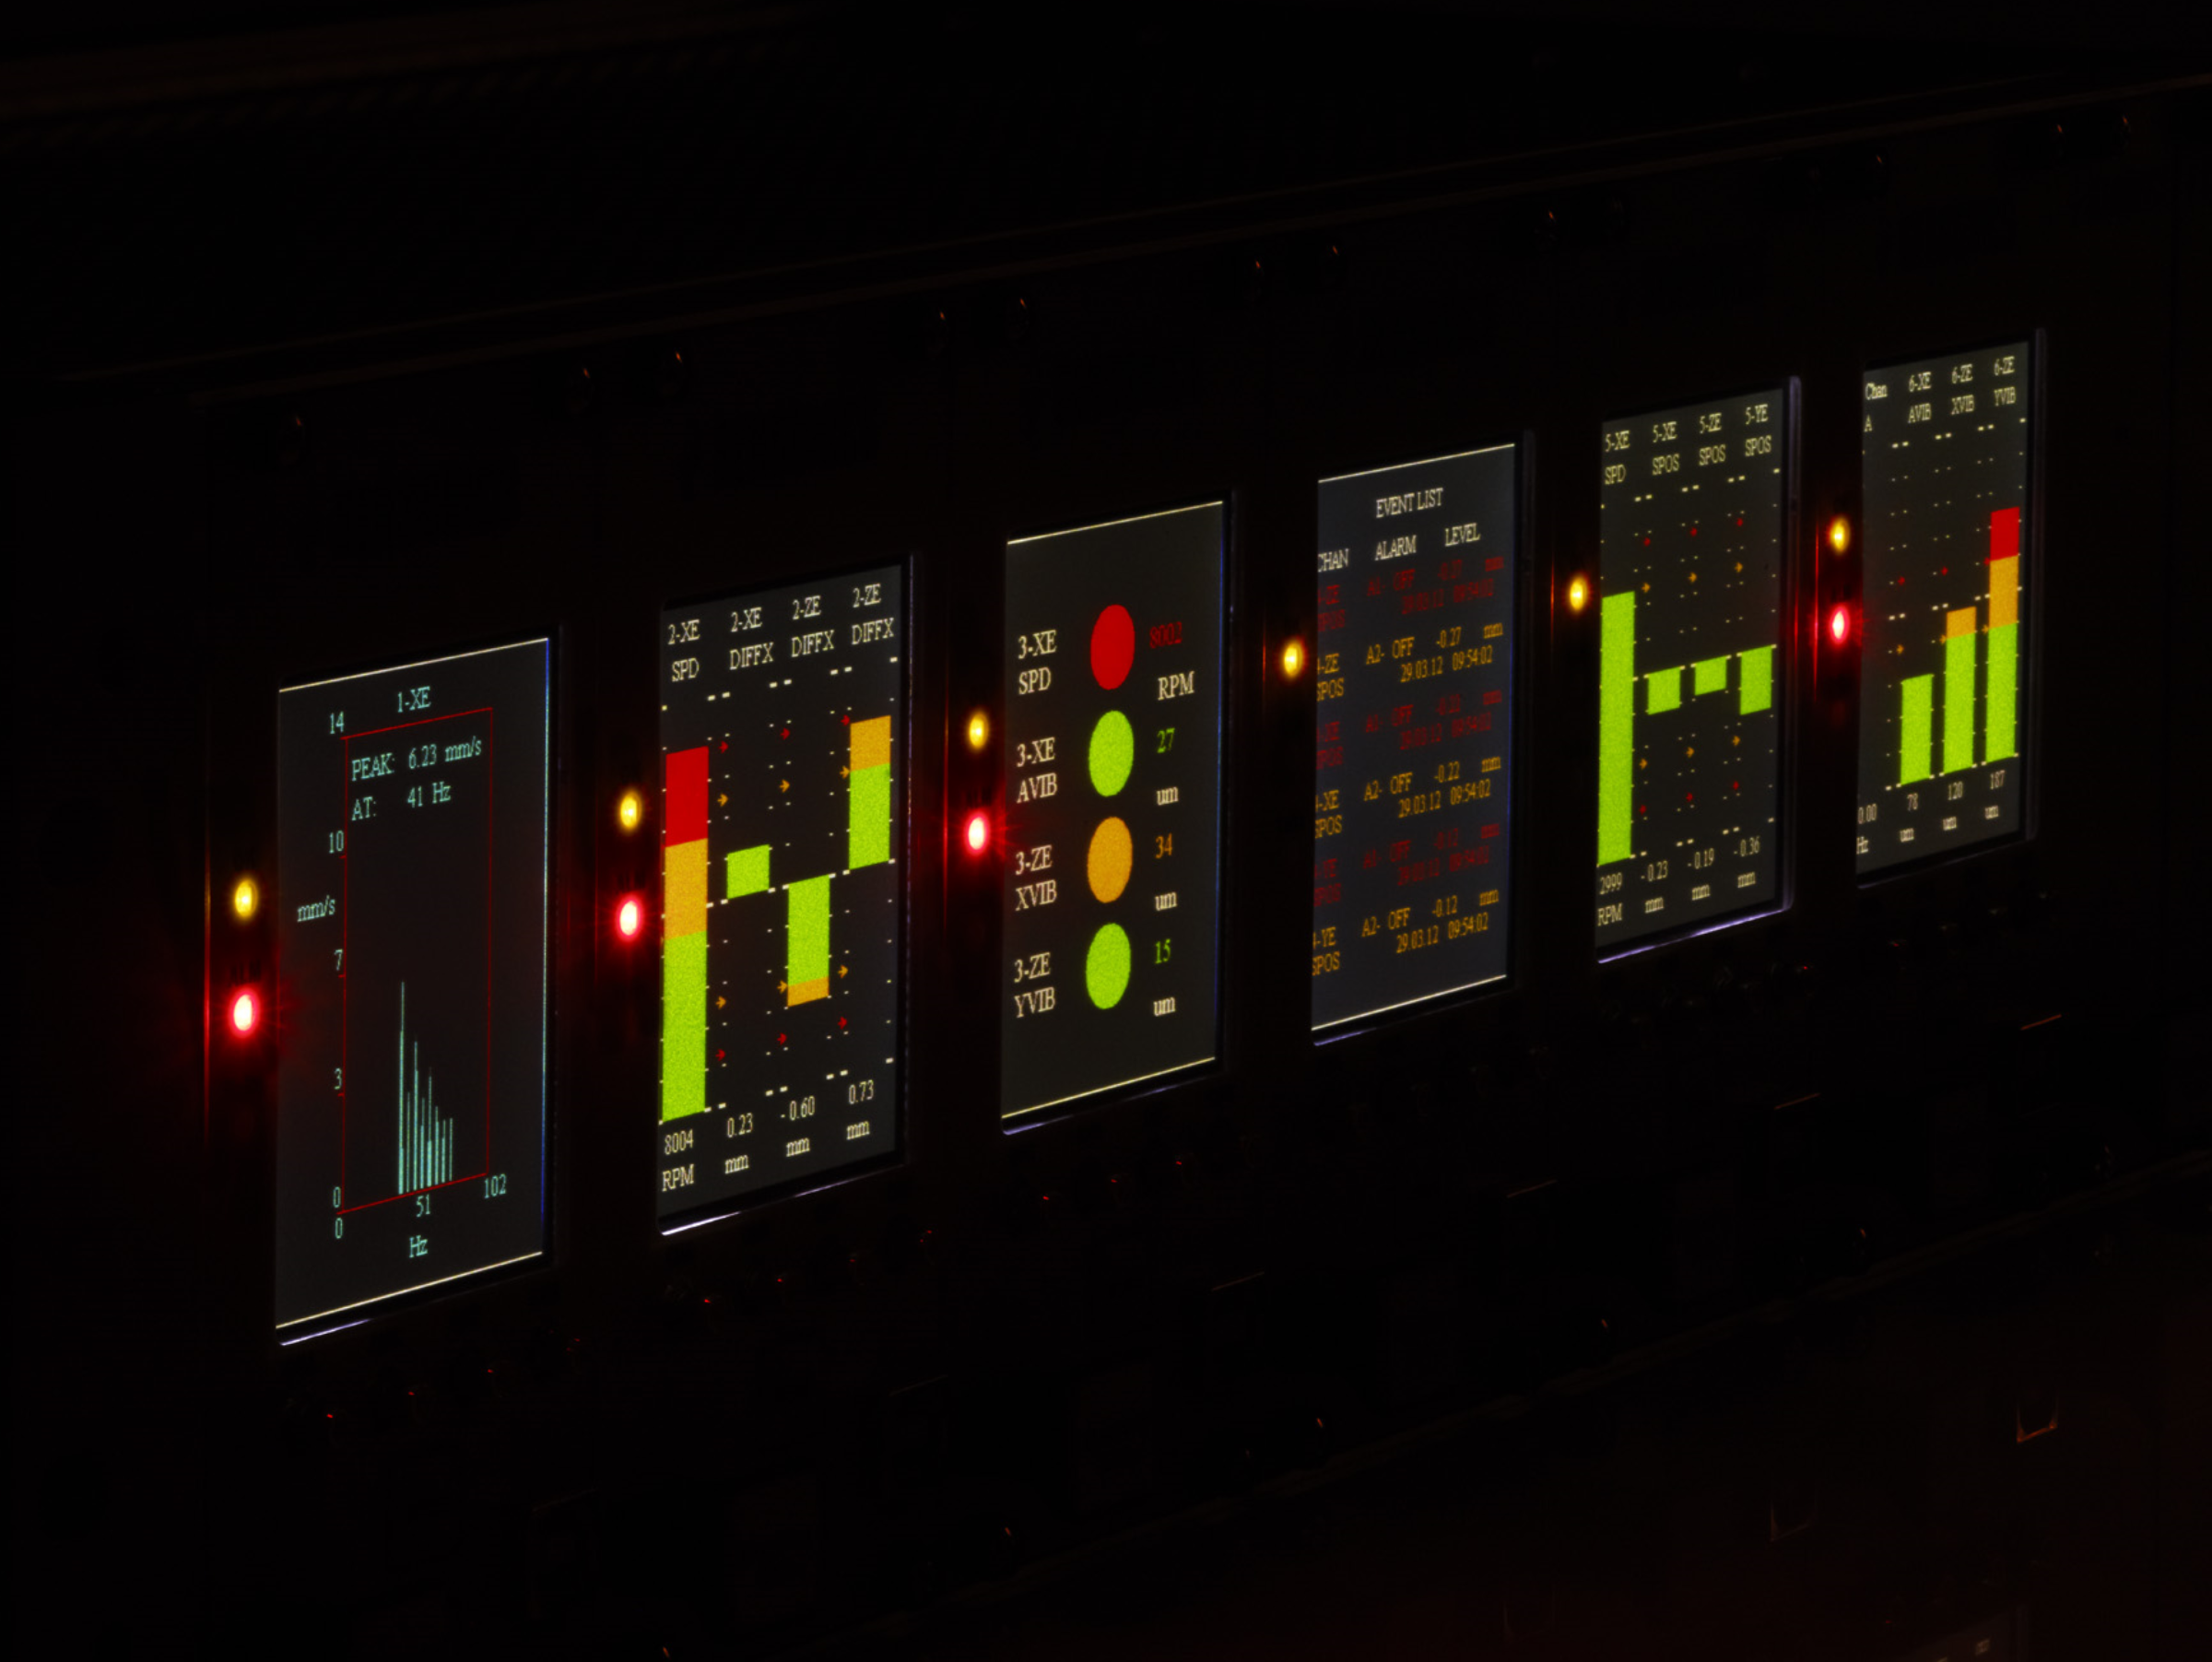
- Real-time alarm identification – allows your operators to instantly detect active alarms via visual indicators on machine-specific graphical displays.
- Alarm historian – the application includes the ability to store and review historical alarm data for a deeper understanding of recurring issues, allowing you to make focused improvements – more on this below.
- Visualisations – active alarms are displayed alongside the corresponding machine data, instantly linking system alerts to their root causes.
Benefits to you: the Sentry G3 streamlines your alarm management processes by ensuring that operators can focus on highest priority concerns first, thereby reducing response times and improving overall system reliability.
How data visualisation supports operational efficiency?
What about data visualisation? On its own, the complex data from industrial monitoring systems is not always comprehensible to operators. Data visualisation transforms this raw data into an understandable format that allows operators to grasp interrelated situations and system conditions at a glance, recognising anomalies as they occur and keeping on top of trends.
Data visualisation features to look for in an application include:
- Machine status overview: the Sentry G3 gives operators a flexible graphical interface through which they can observe critical parameters, including temperature, vibration levels, and so on, through a series of colour-coded indicators and symbols.
- Historical data mapping: your operational data is one of your strongest assets for improving efficiency and monitoring safety. ‘Historical data trending’ allows you to view historical trends alongside current data for immediate side by side comparisons. You can also drill down into periodic trends or data from specific events, giving you insights into system performance over time.
- Integration potential: many industrial and power generation facilities operate several machine monitoring systems, so the Sentry G3 allows you to combine data from various plant-wide parameters and systems within its data feed. This equips your operators with a broader strategic perspective on which to make operational decisions, integrating speed, vibration, and other parameters into a unified dashboard.
Upgrade your monitoring potential with Sensonics
The Sentry G3 SCADA Viewer from Sensonics is a scalable data visualisation and alarm management tool that is configurable to various industrial sectors and applications. To find out how our solutions can help you streamline process control in your facility, optimise your maintenance schedules, and enhance long-term efficiency, please contact one of our knowledgeable team today by clicking here.