
Condition monitoring devices are essential for manufacturing businesses, reducing lengthy or costly repairs to machinery, and preventing accidents that could pose a danger to operatives. Automated condition monitoring ensures that even minor fluctuations in machine performance are detected, allowing emerging problems to be addressed early.

Without a simple way for this data to be reported and interpreted by maintenance managers, condition monitoring equipment can become a white elephant. Reports that are too complex can be misinterpreted, leading to overlooked problems, even by experienced technicians. Condition reports should be presented in a way that staff can instantly spot components that aren’t operating at peak efficiency, with an indication of performance stated alongside acceptable parameters.
How The Sentrycms Application Can Benefit Your Business
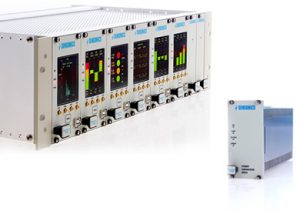
The SentryCMS condition monitoring system is an invaluable add-on to the Sentry G3 API670 machine protection system. A suite of flexible data acquisition tools works in combination with powerful analysis models to monitor machine performance.
At the core of SentryCMS is an intuitive user interface. Data about machine performance is acquired from a range of operational states and alarm conditions, and relayed to the central dashboard in real time. SentryCMS can report in various formats, which can be analysed live or when the systems are offline. Types of analysis include:
1) Shaft Orbit: The orbit display can be configured for overall performance or filtered to a selected order. Time waveforms for X and Y channels are displayed according to the chosen cycle number. Rotor imbalance, rubs, and instabilities are all reported.
2) Time Waveform: The system gathers waveform data up to a sampling rate of 25kHz. The waveform display provides multiple markers, with the ability to capture the graph in an image file from any display.
3) Frequency Analysis: Frequency data can be displayed in Campbell and Waterfall formats, providing in-depth analysis of machine speeds, in addition to the effect on turbine blade vibration frequencies and damping. Graphical zoom and rotation tools are part of the professional user interface.
4) Bode And Trend Plots: Vibration magnitude can be displayed against speed, with calculation of critical speeds and the detection of vibration vector changes. Multiple channels can be overlaid for current and historical data.
5) Shaft Centreline: Shaft centreline plots use the proximity probe DC gap voltage to analyse radial rotor position changes, relating to the stationary bearing over speed and time ranges. When combined with the orbit analysis, additional analysis of the bearing performance is possible.
Improve Your Condition Monitoring Analytics With Sensonics
At Sensonics, we support your business to achieve outstanding reporting capabilities, so you can make informed decisions about how to manage your equipment. For more information, please get in touch today by email or phone.